How Fast Should Your Website Load?
By Egor · · 10 min read
Short answer: on a phone, your main content should appear within about 2.5 seconds. Past 4 seconds you’re losing people who will never tell you they left.
The test is free and takes a minute: go to pagespeed.web.dev and paste your address. I ran it on four real small business sites on the same afternoon, and the results ranged from 10 out of 100 to 100 out of 100.

The number that matters
PageSpeed gives you a big score out of 100, and that score is the least useful thing on the page. It’s a weighted summary of several measurements, so a middling number tells you almost nothing about what’s wrong.
The measurement to look at is Largest Contentful Paint, or LCP. It’s the time until the biggest thing on screen finishes loading: your hero image, your headline, the photo of your food. In plain terms, it’s how long someone stares at a blank or half-drawn page before your site looks like a site.
Google’s thresholds are straightforward:
- Under 2.5 seconds — good
- 2.5 to 4 seconds — needs improvement
- Over 4 seconds — poor
That’s the one to fix. The score follows.
Two others are worth knowing by name. Cumulative Layout Shift measures how much the page jumps around while loading — the reason you tap the wrong button because something loaded above it. Total Blocking Time measures how long the page is frozen and ignoring your taps, even though it looks ready.
Four sites, one afternoon
All measured on 8 September 2026, mobile and desktop, using PageSpeed’s simulated mid-range Android on a throttled connection.
| Site | Built on | Mobile | Desktop | Mobile LCP |
|---|---|---|---|---|
| A brunch restaurant | Squarespace | 81 | 99 | 3.8s |
| A mobile auto repair shop | Wix | 78 | 96 | 4.8s |
| A Caribbean café | Square Online | 10 | 23 | 16.8s |
| ametedge.com (mine) | Custom, Next.js | 94 | 100 | 3.0s |
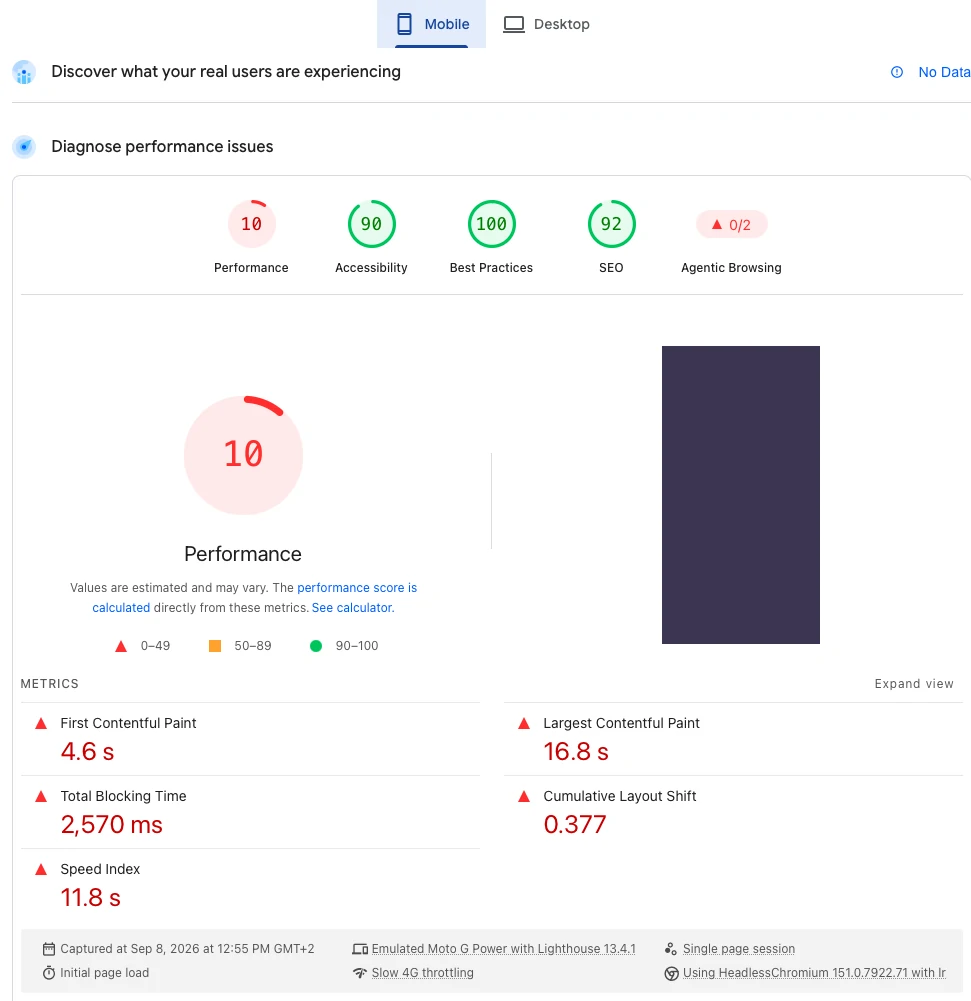
16.8 seconds. That’s the café. Sixteen point eight seconds before the main content of the page finishes appearing, on a phone, which is where nearly all of their customers are. The page is also shifting around the whole time, and it’s frozen and unresponsive for over two and a half seconds while it works.
The diagnostics explain where it goes: 2,681 KiB of page weight, 703 KiB of JavaScript that is downloaded and never used, 6.1 seconds of main-thread work, 13 long tasks. This is a menu and an order button. It shouldn’t weigh more than a photograph.
The two builder sites are unremarkable, which is the point: Squarespace and Wix are not slow platforms. Both scored fine. The catastrophic one is also on a platform. What separates them is what got put on the page.
The desktop trap
Look at the two columns again. Every single site scores far better on desktop than mobile. The brunch restaurant: 99 on a laptop, 81 on a phone. The auto shop: 96 and 78.
The owner checks their site from the office computer on office wifi. It’s instant. There’s no problem to see.
Their customer is standing outside on a mid-range Android with two bars of signal, and gets a completely different website.
Google indexes and ranks based on the mobile version. So does your customer’s patience.
There’s a wrinkle in the café’s numbers worth flagging, because it breaks the pattern. Its desktop Total Blocking Time is 7,390ms — nearly three times worse than its mobile figure of 2,570ms, and its desktop main-thread work runs to 14.7 seconds. When a site is bad enough, “desktop is fine” stops being true too.
The scores move, so don’t panic over one reading
I measured these same three sites about a month ago. Here’s what changed:
| Site | Mobile then | Mobile now |
|---|---|---|
| Brunch restaurant | 49 | 81 |
| Auto repair shop | 75 | 78 |
| Caribbean café | 18 | 10 |
The restaurant nearly doubled. The café got worse. As far as I can tell, nobody at either business did anything.
Lighthouse scores vary between runs. Server load, network conditions, third-party scripts having a bad day, the test machine itself — all of it moves the number. A single reading is a snapshot, not a diagnosis.
Two practical consequences. Don’t celebrate or panic over one test; run it a few times across a few days. And don’t judge by the headline score at all — the café was awful at 18 and is awful at 10, and the specific measurements said so consistently while the score bounced around.
The fifth score nobody asked about
If you’ve run PageSpeed recently you may have noticed something new sitting beside Performance, Accessibility, Best Practices and SEO: Agentic Browsing.
It arrived in Lighthouse 13.3 in May 2026 and shows as a ratio rather than a score out of 100. It asks a different question from the rest: if an AI agent came to this page, could it understand the structure and use the buttons without guessing? The default checks cover whether interactive elements are properly labelled for a machine, whether the page stays still while being read, and whether there’s an llms.txt file at the root.
Here’s how the four sites did:
| Site | Agentic Browsing |
|---|---|
| Brunch restaurant | 2/2 |
| Auto repair shop | 3/3 |
| Caribbean café | 0/2 |
| ametedge.com | 3/3 mobile, 2/3 desktop |
The café fails every check. A page that takes 16.8 seconds and shifts constantly isn’t just hostile to people; software can’t reliably use it either. That matters more than it used to, because assistants are increasingly the thing reading your site on a customer’s behalf.
Two honest caveats. The category is explicitly marked “under development,” and it is not a ranking factor. And note that one of its three checks is the presence of llms.txt — a file I’ve argued elsewhere does nothing measurable for actual AI citations. Passing this check is not the same as being useful to an AI. It’s a checkbox that happens to be cheap to tick.
What actually makes a site slow
From the diagnostics of the four sites, in order of how often it came up.
Images that are far bigger than they’re displayed. A 4000-pixel photo squeezed into a 400-pixel space still downloads all 4000 pixels. This appeared on three of the four sites.
JavaScript that’s downloaded and never used. The café ships 703 KiB of unused JavaScript on mobile. The auto shop, 129 KiB. Mine, 69 KiB. This is what platforms and plugins do: everything loads on every page in case some page needs it.
Render-blocking requests. Files the browser must finish fetching before it can draw anything. The brunch restaurant loses 1,150ms to this — over a second of pure waiting before drawing starts. Mine loses 520ms, which is also not nothing.
Third-party scripts. Chat widgets, analytics, booking tools, review badges, tracking pixels. Each one is a request to somebody else’s server, and you inherit their bad day. The auto repair shop’s report carries a warning for more than four preconnect connections.
Images without dimensions set. Cheap to fix and it’s a large part of why pages jump while loading.
My own site isn’t perfect either
It would be convenient to stop at 94 and 100 and move on. Here’s the rest.
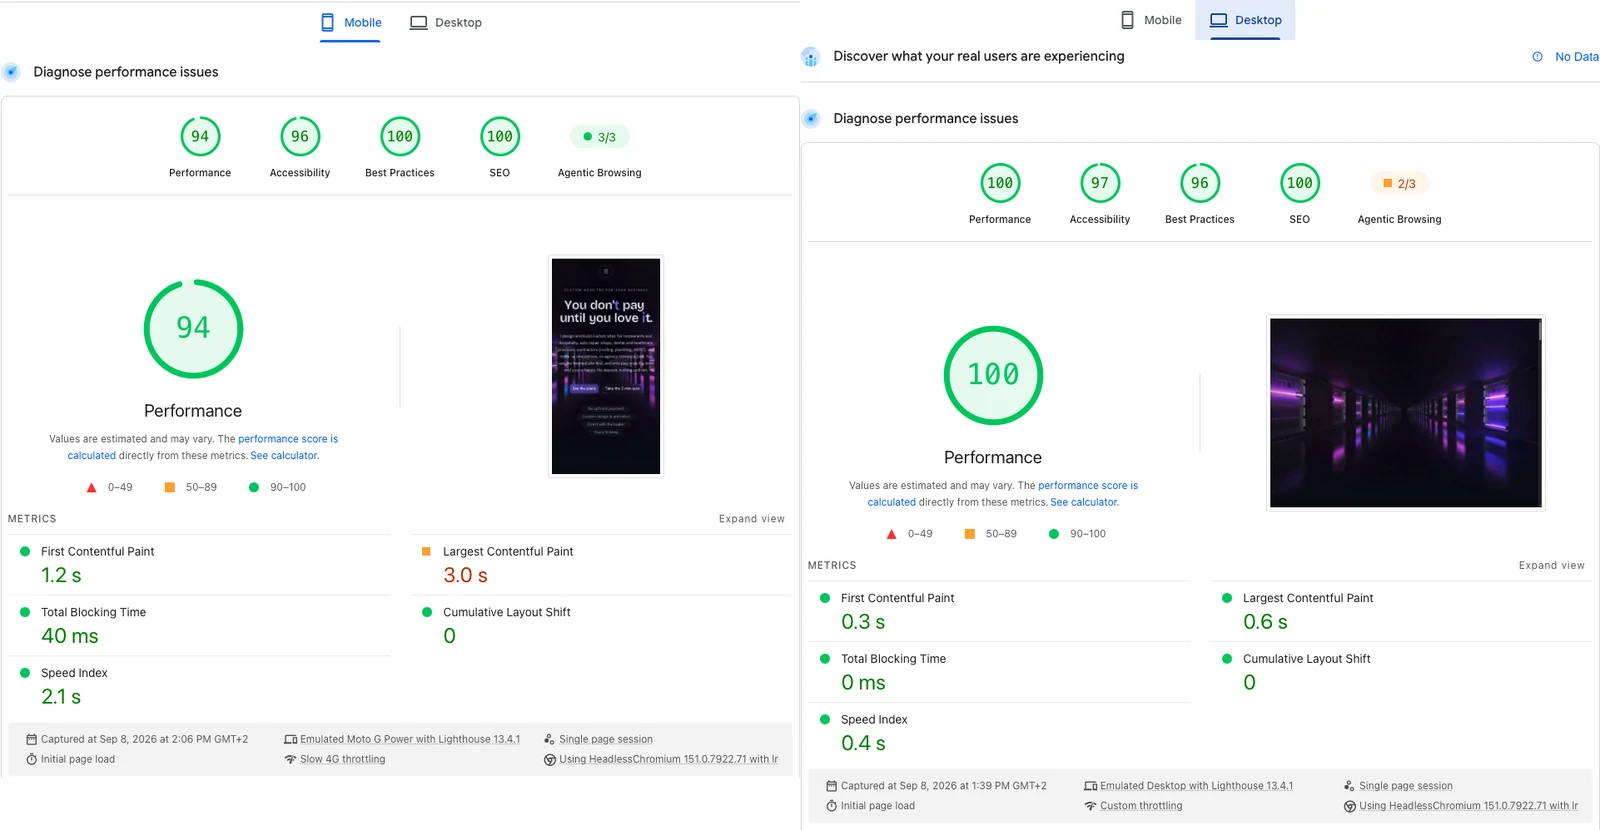
My mobile LCP is 3.0 seconds, which is in Google’s amber band, not the green one. The reason is the animated background on my homepage: it looks good and it costs me about half a second on a phone. That’s a trade I’ve chosen, but it is a trade, and I’d rather write that down than pretend the number is green.
The diagnostics also list 248 KiB of unused JavaScript on desktop, 26 non-composited animations, and 520ms lost to render-blocking requests. My desktop Agentic Browsing score is 2/3 while mobile is 3/3, which I haven’t got to the bottom of yet.
None of this is an emergency. All of it is real. A site that scores 100 on desktop still has a list, and anyone who tells you their work has no list hasn’t looked.
How to test yours
- Go to pagespeed.web.dev and paste your address.
- Read the Mobile tab. The desktop tab is the flattering one.
- Find Largest Contentful Paint. Under 2.5s good, 2.5–4s needs work, over 4s poor.
- Run it again tomorrow, and the day after. One reading is noise.
- Scroll to Insights and Diagnostics. Each entry names a specific problem and an estimated saving.
- Start with images. It’s the most common cause and the cheapest to fix.
- Then look at what’s loading that you don’t use. Old plugins, a chat widget nobody answers, tracking for a campaign that ended.
If you’d rather someone else looked, I’ll run the audit and send you the list, whether or not you ever hire me.
How fast should a website load?
On a phone, your main content should appear within 2.5 seconds. Between 2.5 and 4 is workable but costing you visitors. Over 4 seconds is where people start leaving before they’ve seen anything.
Why is my website so slow?
Usually oversized images, unused JavaScript from a platform or plugins, or third-party scripts. Run the test and read the Diagnostics section — it names the specific causes and estimates what each one costs you.
Why is my Wix site slow?
It may not be. The Wix site in this article scored 78 on mobile, which is unremarkable rather than bad. Builders load more code than a hand-built site does, but the worst site I measured wasn’t Wix, and the best builder result beat plenty of custom work. Test yours before assuming the platform is the problem.
Does site speed affect Google rankings?
Yes, though less than people assume. Core Web Vitals are a ranking signal, and Google indexes the mobile version. But speed is a tiebreaker rather than a lever: a fast page about the wrong thing still won’t rank.
Is a perfect 100 worth chasing?
No. The gap between 60 and 90 is worth real money. The gap between 90 and 100 is usually worth less than whatever you’d give up to get it. My own mobile score is 94 and I’m not planning to fix that.
Written by Egor, founder and developer at AmetEdge. I build custom websites for small businesses across the US: restaurants and cafés, auto repair and body shops, contractors and home services, dental and medical clinics, salons and studios, gyms and trainers, and plenty of others. No agency, no upfront payment, and you own everything at the end.